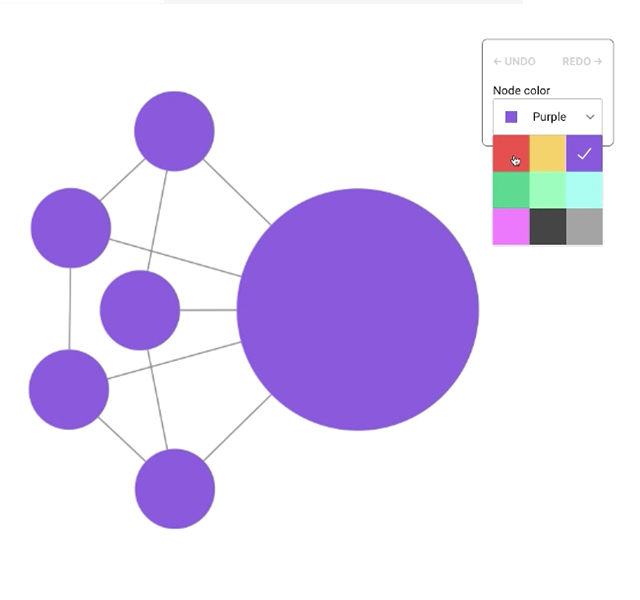
SolidJS tutorial: get your KeyLines app into pole position
Ryan Shimmon Commercial Software Developer
31st August, 2025 | 7 min read
In this SolidJS tutorial, I’ll show you how to create a simple web app using this lightweight React-like...
Ryan Shimmon Commercial Software Developer
31st August, 2025 | 7 min read
In this SolidJS tutorial, I’ll show you how to create a simple web app using this lightweight React-like...
Phil Rodgers Principal Team Lead
20th August, 2025 | 5 min read
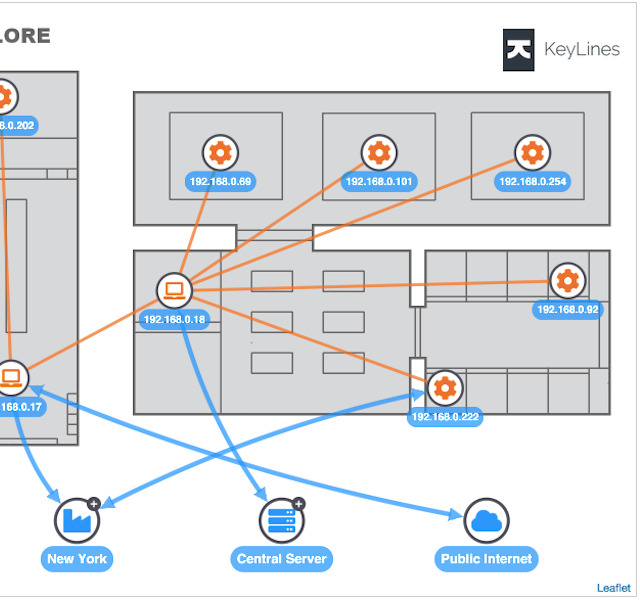
This developer tutorial demonstrates how to use images as backdrops. With detailed code examples throughout,...
Ellen Cato European Sales Manager
18th August, 2025 | 8 min read
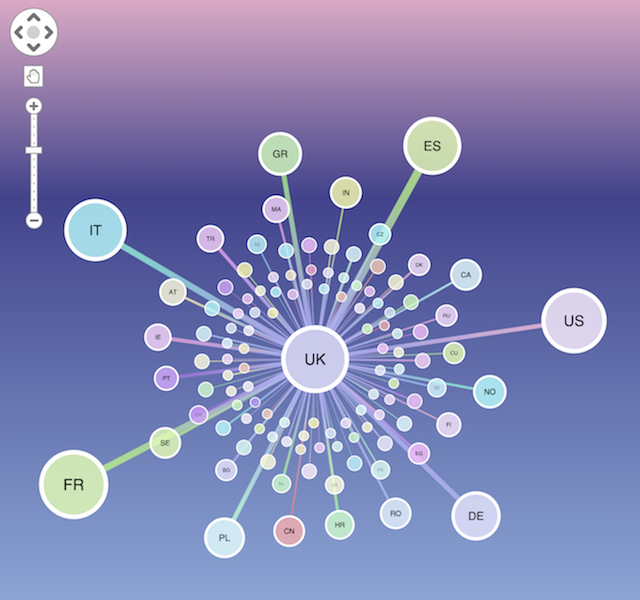
How to visualize graph data using the Amazon Neptune graph database and ReGraph, a React toolkit for graph...
Ryan Shimmon Commercial Software Developer
12th August, 2025 | 10 min read
This tutorial shows how to integrate data visualization with ChatGPT, OpenAI’s large language model (LLM)...
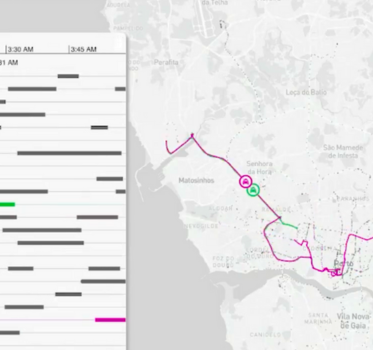
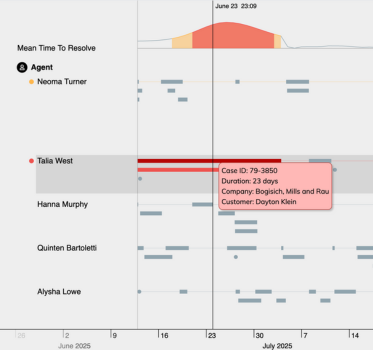
Jan Girman Product Manager
5th August, 2025 | 10 min read
Pattern-of-life analysis reveals habits and behaviors in complex data. See how timeline and geospatial...
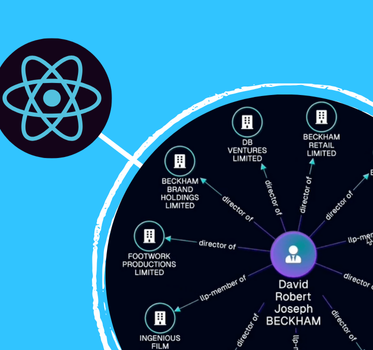
Ryan Shimmon Commercial Software Developer
28th July, 2025 | 10 min read
In this technical post, Matt from our development team shares one of the ways he uses React Hooks to produce...
Courtney Collins Product Manager
22nd July, 2025 | 10 min read
If you’re looking for a graph visualization toolkit, the first question that may come to mind is whether that...
Rosy Hunt Content Marketing Specialist
10th July, 2025 | 4 min read
The newest versions of our data visualization tools bring features that make them faster, better-looking, and...
Zach Mason Product Designer
24th June, 2025 | 18 min read
We share expert graph visualization UX principles that make the difference between user frustration and...
Registered in England and Wales with Company Number 07625370 | VAT Number 113 1740 61
6-8 Hills Road, Cambridge, CB2 1JP. All material © Cambridge Intelligence .
Privacy Policy | Security Framework
