A product manager’s guide to data visualization options
Catherine Kearns Content Strategist & Team Lead
28th February, 2023 | 10 min read
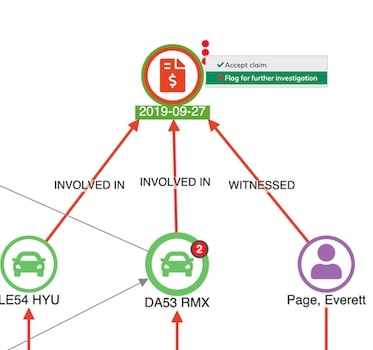
We’ve blogged before about the benefits of graph visualization SDKs over open source graph libraries. There are...