
How Hume & KeyLines make levels of insight skyrocket
Catherine Kearns Content Strategist & Team Lead
18th August, 2020 | 7 min read
Find out how GraphAware’s Hume and KeyLines help the European Space Agency see the power of Natural Language...
Catherine Kearns Content Strategist & Team Lead
18th August, 2020 | 7 min read
Find out how GraphAware’s Hume and KeyLines help the European Space Agency see the power of Natural Language...
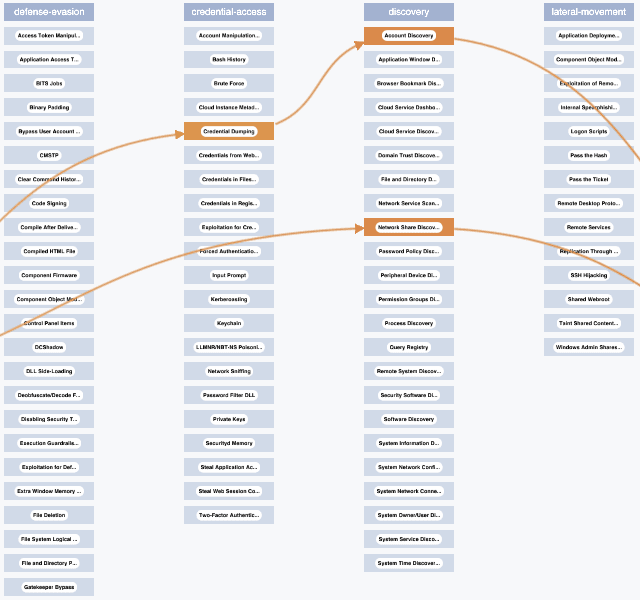
Dan Williams Chief Product Officer
11th August, 2020 | 8 min read
With examples from the cyber security world, this blog focuses on six clever customization options in KeyLines and...
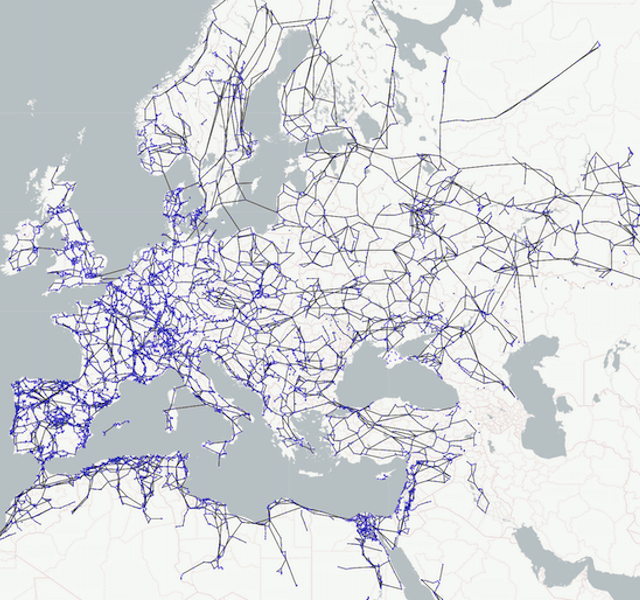
Christian Miles VP of Sales
4th August, 2020 | 11 min read
We explore the fascinating world of energy infrastructure by visualizing the network of energy pipelines routing...
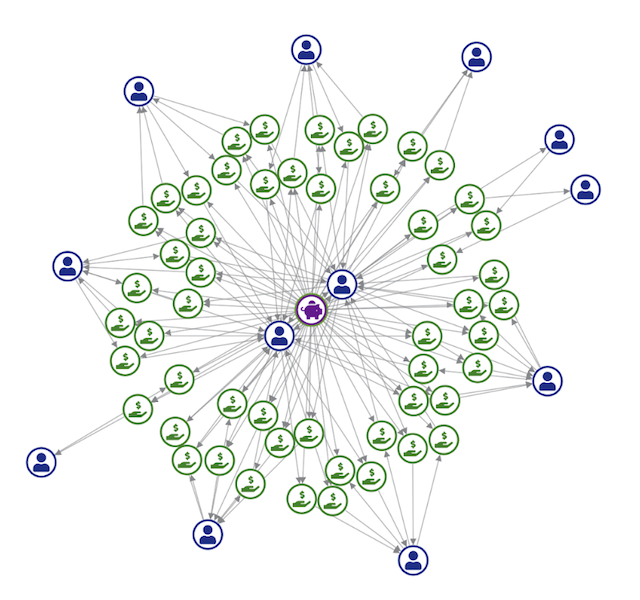
Rosy Hunt Content Marketing Specialist
6th July, 2020 | 6 min read
How to use graph visualization and AML techniques to detect money-laundering and high-risk cryptocurrency...
Rosy Hunt Content Marketing Specialist
30th June, 2020 | 6 min read
This blog post explores how US authorities have firmed up their AML regulations in response to the rising...
Catherine Kearns Content Strategist & Team Lead
15th June, 2020 | 6 min read
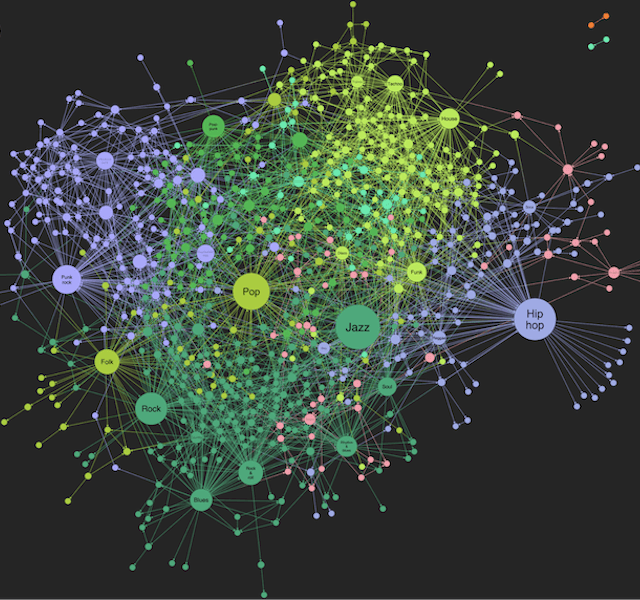
There’s a growing need for apps that design the best strategic collaborations, bringing together the right...
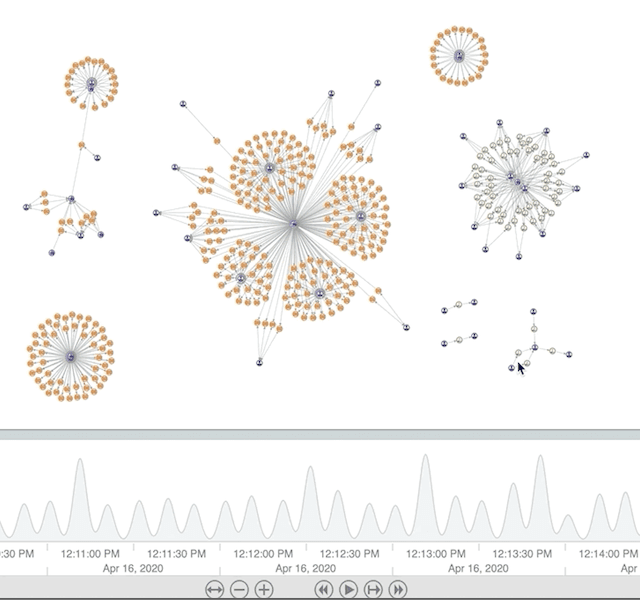
Andrew Disney Marketing Director
20th April, 2020 | 6 min read
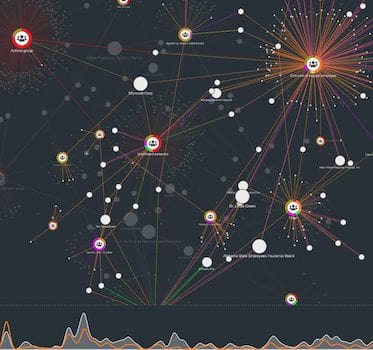
Visualizing the VERIS community database of data breaches: How graph visualization can help us extract insight...
Christian Miles VP of Sales
3rd February, 2020 | 10 min read
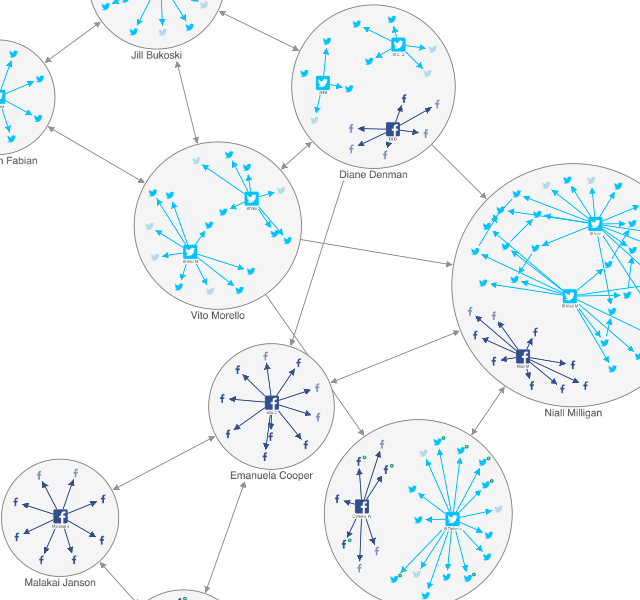
In this developer tutorial, we’ll use SPARQL to query a DBpedia knowledge graph visualization of connections...
Andrew Disney Marketing Director
30th January, 2020 | 5 min read
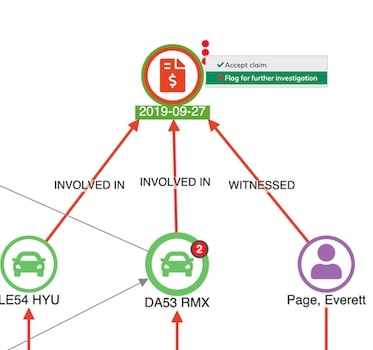
Discover how to use link analysis techniques for fraud detection in this step-by-step example showing typical...
Registered in England and Wales with Company Number 07625370 | VAT Number 113 1740 61
6-8 Hills Road, Cambridge, CB2 1JP. All material © Cambridge Intelligence .
Privacy Policy | Security Framework
