Tailwind CSS tutorial for graph visualization
Ivan Krushkov Commercial Development Lead
16th December, 2025 | 12 min read
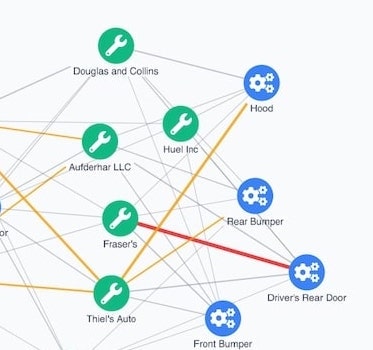
In this Tailwind CSS tutorial, we’ll show you how to customize your ReGraph app and achieve the designs you want...
Ivan Krushkov Commercial Development Lead
16th December, 2025 | 12 min read
In this Tailwind CSS tutorial, we’ll show you how to customize your ReGraph app and achieve the designs you want...
Ryan Shimmon Commercial Software Developer
18th November, 2025 | 8 min read
Use the Elastic UI framework (EUI) to build an interactive graph visualization app that looks good and is ready to...
Rosy Hunt Content Marketing Specialist
26th October, 2025 | 13 min read
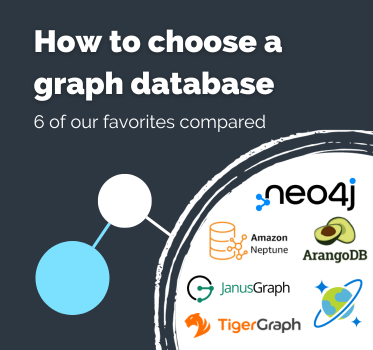
If you’ve found this article, the chances are you: Need to build a powerful graph or graph analytics application...
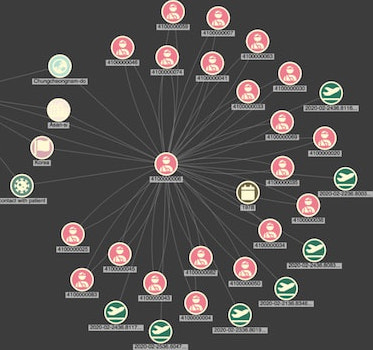
Ryan Shimmon Commercial Software Developer
5th October, 2025 | 9 min read
To build a high-performance, scalable graph visualization application, you need a reliable way to store and query...
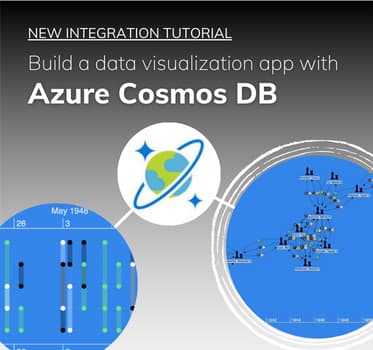
Ryan Shimmon Commercial Software Developer
14th September, 2025 | 19 min read
This Azure Cosmos DB tutorial shows you how to build a graph database visualization application using...
Ryan Shimmon Commercial Software Developer
7th September, 2025 | 10 min read
We’ve seen significant interest in TigerGraph’s fast, scalable graph database platform recently. In response,...
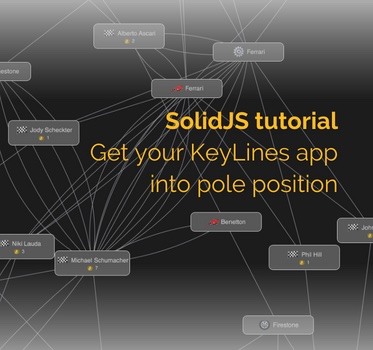
Ryan Shimmon Commercial Software Developer
31st August, 2025 | 7 min read
In this SolidJS tutorial, I’ll show you how to create a simple web app using this lightweight React-like...
Ellen Cato European Sales Manager
18th August, 2025 | 8 min read
How to visualize graph data using the Amazon Neptune graph database and ReGraph, a React toolkit for graph...
Ryan Shimmon Commercial Software Developer
12th August, 2025 | 10 min read
This tutorial shows how to integrate data visualization with ChatGPT, OpenAI’s large language model (LLM)...
Registered in England and Wales with Company Number 07625370 | VAT Number 113 1740 61
6-8 Hills Road, Cambridge, CB2 1JP. All material © Cambridge Intelligence .
Privacy Policy | Security Framework
