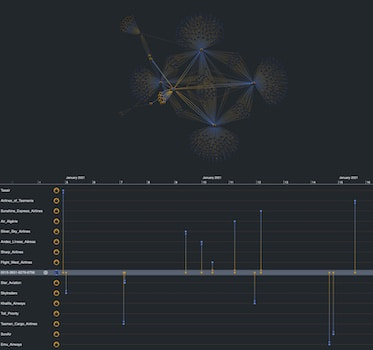
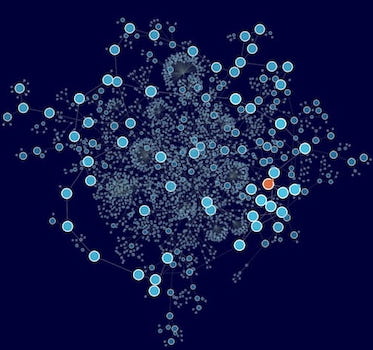
Identity fraud detection with Amazon Neptune
Corey Lanum Chief Product Evangelist
3rd January, 2023 | 15 min read
Follow this tutorial to build an interactive web application – integrated with Amazon Neptune – to...
Corey Lanum Chief Product Evangelist
3rd January, 2023 | 15 min read
Follow this tutorial to build an interactive web application – integrated with Amazon Neptune – to...
Corey Lanum Chief Product Evangelist
8th November, 2022 | 10 min read
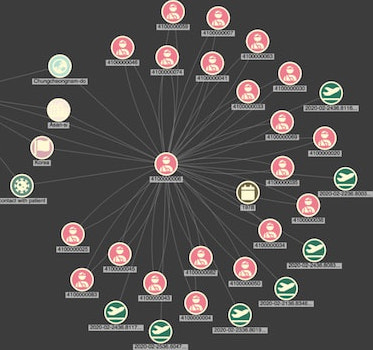
We’ve seen significant interest in TigerGraph’s fast, scalable graph database platform recently. In response,...

Christian Lentfort Developer
13th September, 2022 | 13 min read
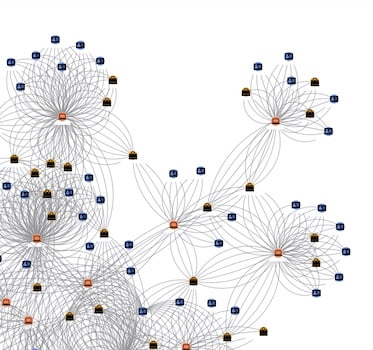
We bootstrapped RedwoodJS to ReGraph, our data visualization toolkit for React developers, to build an app that...
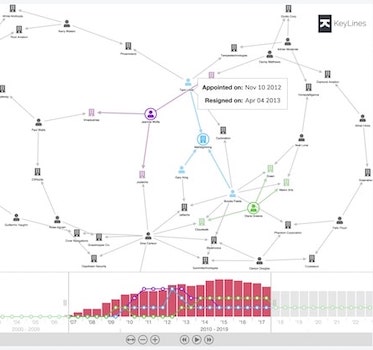
Corey Lanum Chief Product Evangelist
2nd August, 2022 | 13 min read
In this technical blog post, I show you how to get KeyLines, our JavaScript toolkit for graph visualization,...
Corey Lanum Chief Product Evangelist
7th June, 2022 | 9 min read
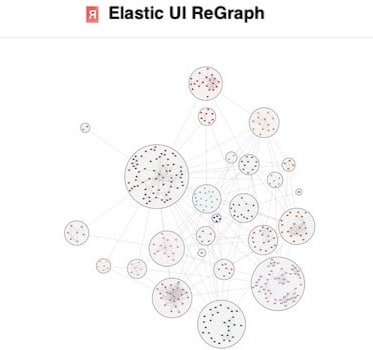
Use the Elastic UI framework (EUI) to build an interactive graph visualization app that looks good and is ready to...
Thomas Chan Software Developer
26th April, 2022 | 8 min read
In this blog post, we use an app built with the ReGraph graph visualization SDK to test the latest Next.js...
Thomas Chan Software Developer
11th February, 2022 | 5 min read
Find out how quick and easy it is to integrate Angular with KeyLines, our graph visualization toolkit for...
Christian Miles VP of Sales
7th February, 2022 | 10 min read
Want to integrate KeyLines or ReGraph with Microsoft Azure Cosmos DB? This developer tutorial gives you full...
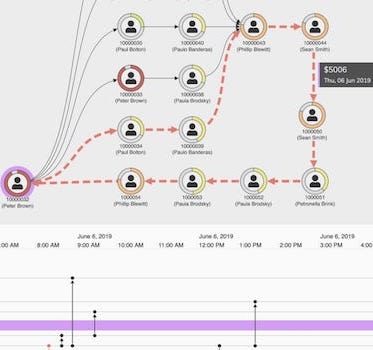
Dan Williams Chief Product Officer
23rd November, 2021 | 11 min read
Let’s explore the world of financial fraud detection using ArangoDB’s powerful query language (AQL)...