Visual network analysis dashboards that work
Christian Miles VP of Sales
22nd June, 2021 | 8 min read
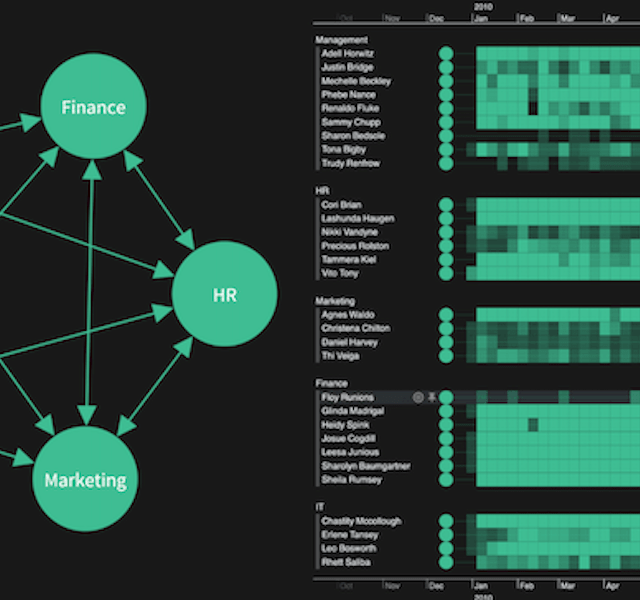
Let’s explore how visual network analysis tools complement dashboards, adding context, interactivity and...
Christian Miles VP of Sales
22nd June, 2021 | 8 min read
Let’s explore how visual network analysis tools complement dashboards, adding context, interactivity and...
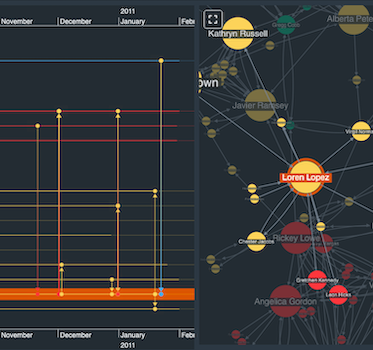
Dan Williams Chief Product Officer
1st June, 2021 | 8 min read
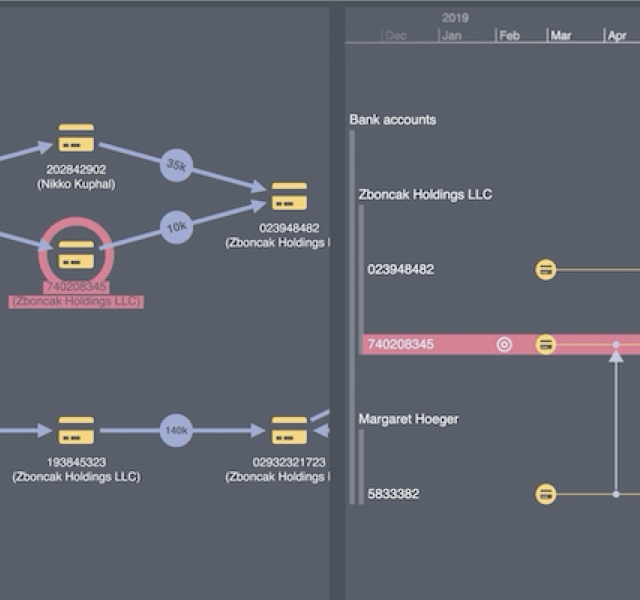
Discover how we use KeyLines & KronoGraph to create flow analysis apps essential for investigating financial...
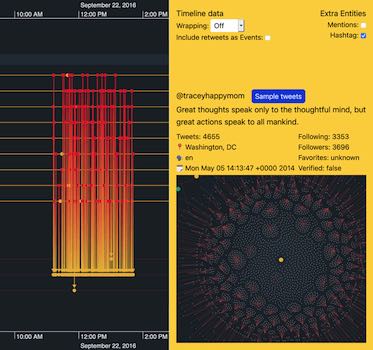
Matt Michel Developer
6th April, 2021 | 8 min read
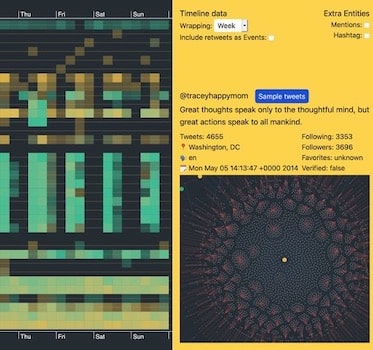
Let’s use KronoGraph and ReGraph to dig deeper into a Twitter data visualization to find patterns of...
Dan Williams Chief Product Officer
10th March, 2021 | 2 min read
KronoGraph users now enjoy faster timeline navigation with support for marquee zoom, plus an updated Storybook and...
Matt Michel Developer
3rd March, 2021 | 8 min read
Create an interactive React application where Neo4j timeline visualization and graph visualization work...
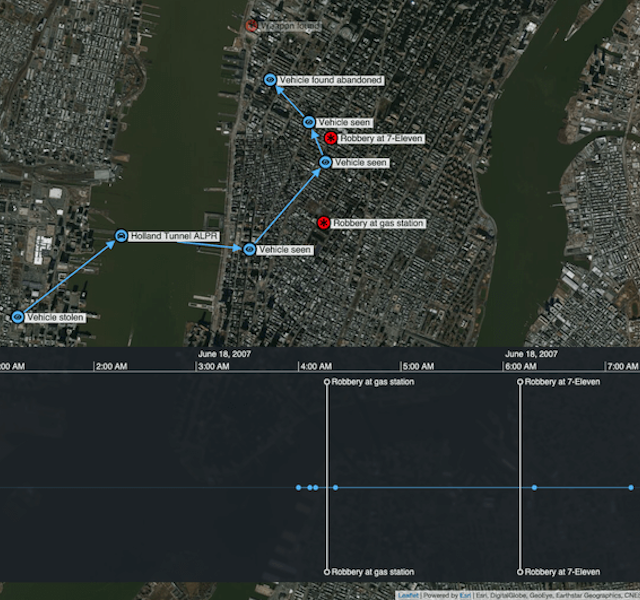
Andrew Disney Marketing Director
23rd February, 2021 | 4 min read
To build a criminal case, investigators collate information from all sources, revealing an accurate and compelling...
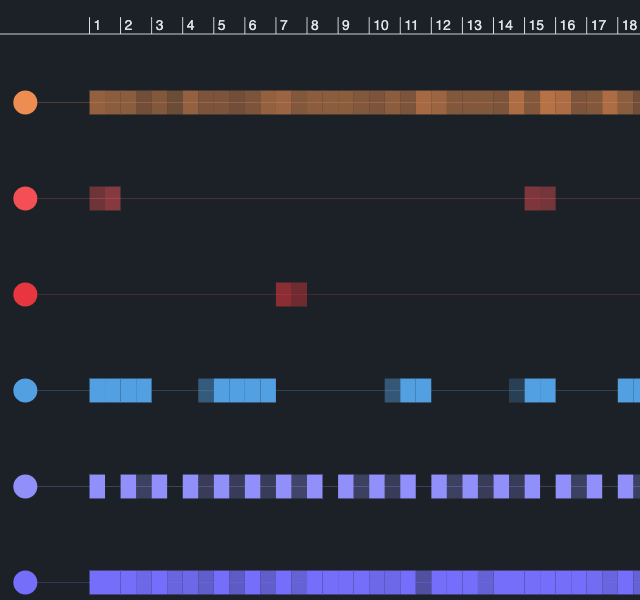
Dan Williams Chief Product Officer
9th February, 2021 | 3 min read
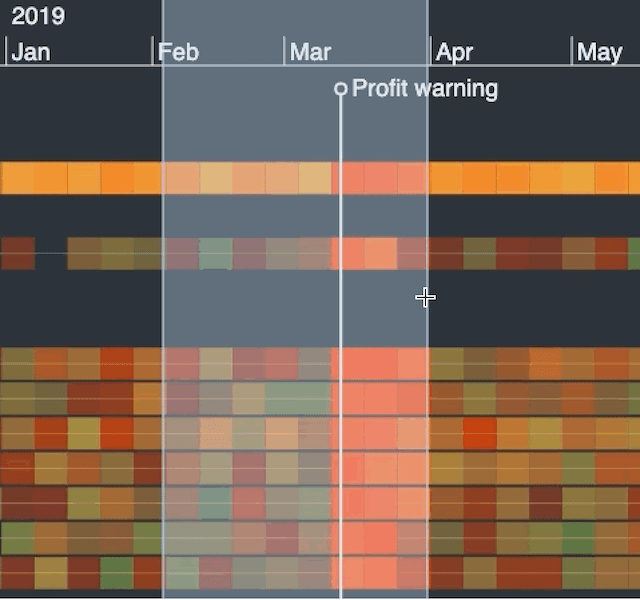
KronoGraph 1.1, our timeline visualization tool, has a clever timeline scale wrapping feature for exploring...
Andrew Disney Marketing Director
26th January, 2021 | 6 min read
Watch any good (trashy) police drama and you’ll quickly spot a few cliches. The maverick cop (tough, but with a...
Christian Miles VP of Sales
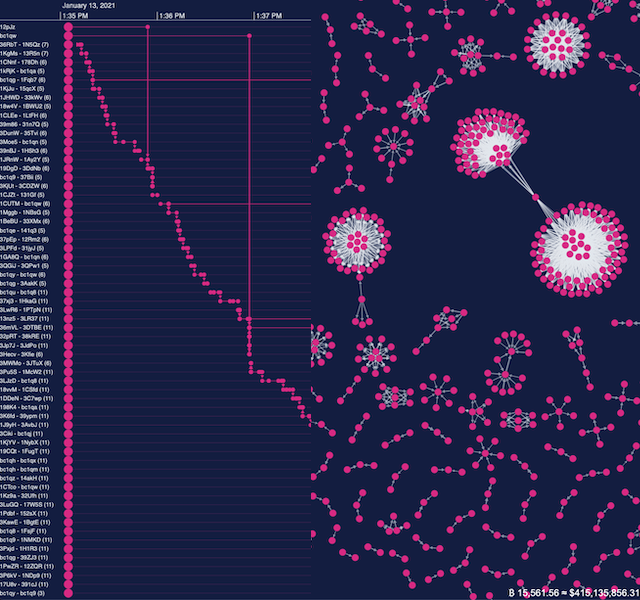
19th January, 2021 | 10 min read
Find out how to use KeyLines and KronoGraph to create your own live, integrated Bitcoin timeline and chart...
Registered in England and Wales with Company Number 07625370 | VAT Number 113 1740 61
6-8 Hills Road, Cambridge, CB2 1JP. All material © Cambridge Intelligence .
Privacy Policy | Security Framework
