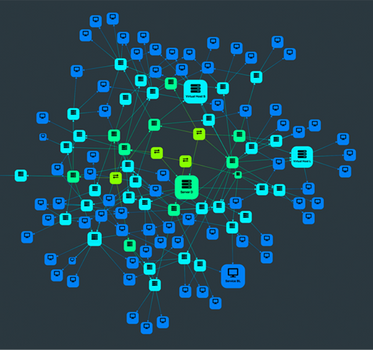
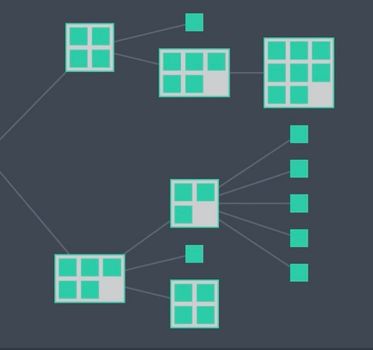
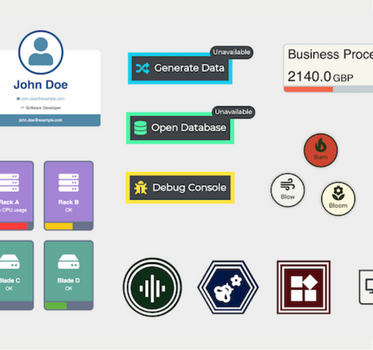
Blog > ReGraph

Product updates: More flexibility with demos and combos

Product updates: More flexibility with demos and combos

Senior Product Manager
27th September, 2022 | 2 min read

The latest releases of our graph visualization SDKs bring more control over combos, and a live coding environment...

Geospatial data visualization with ReGraph and RedwoodJS

Geospatial data visualization with ReGraph and RedwoodJS

Developer
13th September, 2022 | 13 min read

We bootstrapped RedwoodJS to ReGraph, our data visualization toolkit for React developers, to build an app that...

C3 AI: Predictive insights with graph-powered enterprise AI

C3 AI: Predictive insights with graph-powered enterprise AI

Marketing Director
5th July, 2022 | 7 min read

In this blog post, we’ll see how C3 AI – the enterprise AI pioneers – uses graph and timeline...

Decentralizing the internet with Synternet & ReGraph

Decentralizing the internet with Synternet & ReGraph

Content Marketing Specialist
20th June, 2022 | 6 min read

In this blog you’ll see how Syntropy, a global team of web3 pioneers, use our network visualization toolkits to...

Sequential layout: the best way to handle tiered data

Sequential layout: the best way to handle tiered data

Principal Team Lead
15th June, 2022 | 6 min read

Sequential layout is the best choice for tiered data containing distinct levels of nodes. Find out what makes it...

Elastic UI framework & ReGraph tutorial

Elastic UI framework & ReGraph tutorial

Chief Product Evangelist
7th June, 2022 | 9 min read

Use the Elastic UI framework (EUI) to build an interactive graph visualization app that looks good and is ready to...

Product update: coding playground & testing APIs

Product update: coding playground & testing APIs

Chief Product Officer
31st May, 2022 | 2 min read

The latest updates to our graph visualization toolkits include new testing APIs and a live-coding...

Bitcoin visualization: analyzing a charity’s success with crypto

Bitcoin visualization: analyzing a charity’s success with crypto

Product Manager
10th May, 2022 | 7 min read

We use bitcoin visualization to track how one charity’s clever cryptocurrency activity boosted donation values...

WannaCry analysis: visualizing their ransomware attack

WannaCry analysis: visualizing their ransomware attack

Product Manager
4th May, 2022 | 8 min read

Remember the WannaCry ransomware attack? Launched in May 2017, it was one of the most devastating and extensive...

Registered in England and Wales with Company Number 07625370 | VAT Number 113 1740 61
6-8 Hills Road, Cambridge, CB2 1JP. All material © Cambridge Intelligence .
Read our Privacy Policy.