Unlocking unstructured data analysis with Unstruk
Rosy Hunt Content Marketing Specialist
1st February, 2022 | 6 min read
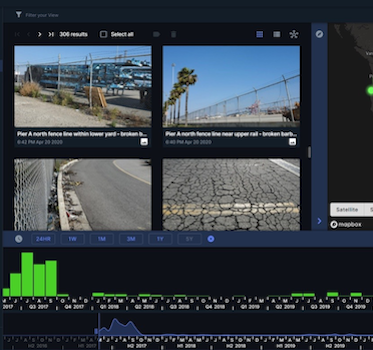
Unstruk Data’s unstructured data platform uses ReGraph to help people transform big, complex data into...
Rosy Hunt Content Marketing Specialist
1st February, 2022 | 6 min read
Unstruk Data’s unstructured data platform uses ReGraph to help people transform big, complex data into...
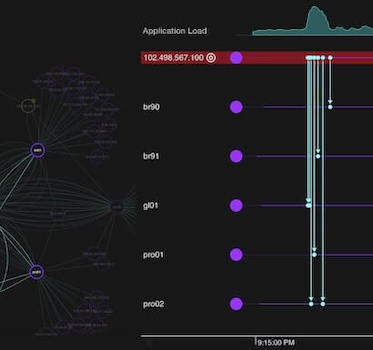
Thomas Chan Software Developer
25th January, 2022 | 12 min read
Our updated guide to building a custom root cause analysis timeline and graph visualization app in React, with...
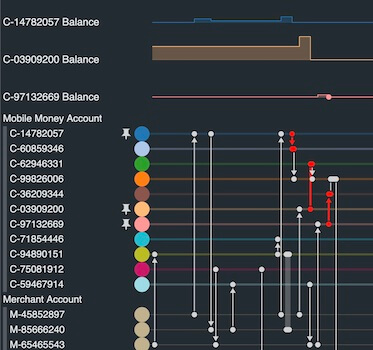
Warren Fitzhenry Principal Team Lead
18th January, 2022 | 8 min read
Let’s look at mobile money fraud detection techniques using KronoGraph’s powerful combination of time...
Dan Williams Chief Product Officer
23rd November, 2021 | 11 min read
Let’s explore the world of financial fraud detection using ArangoDB’s powerful query language (AQL)...
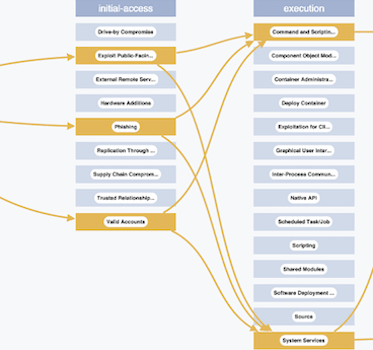
Dan Williams Chief Product Officer
24th August, 2021 | 7 min read
I’ll demonstrate how adding the MITRE ATT&CK framework to your data visualizations can power your...
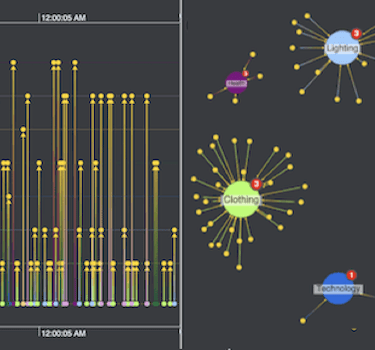
Khadeja Sajjad Software Developer
17th August, 2021 | 10 min read
In this post, I’ll aim to spot fake Amazon reviews using the powerful graph and timeline data visualization...
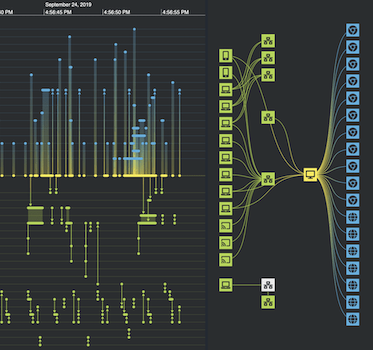
Dan Williams Chief Product Officer
27th July, 2021 | 9 min read
Find out how to use network visualization and forensic timeline analysis to make sense of complex, high-velocity...
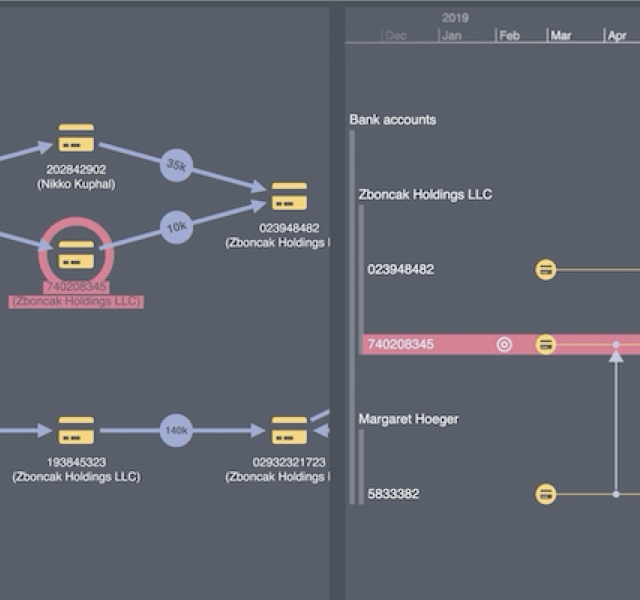
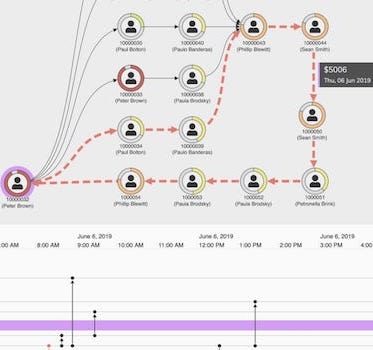
Dan Williams Chief Product Officer
1st June, 2021 | 8 min read
Discover how we use KeyLines & KronoGraph to create flow analysis apps essential for investigating financial...
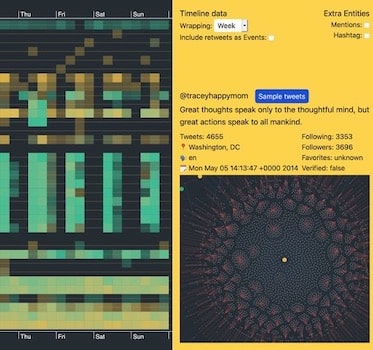
Matt Michel Developer
6th April, 2021 | 8 min read
Let’s use KronoGraph and ReGraph to dig deeper into a Twitter data visualization to find patterns of...
Registered in England and Wales with Company Number 07625370 | VAT Number 113 1740 61
6-8 Hills Road, Cambridge, CB2 1JP. All material © Cambridge Intelligence .
Privacy Policy | Security Framework
