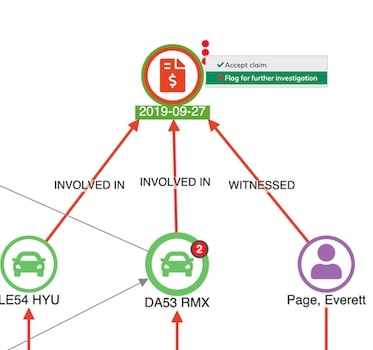
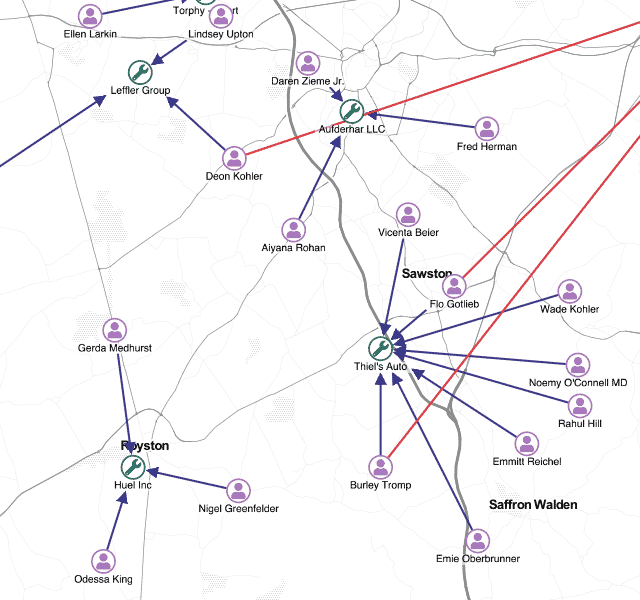
Link analysis for fraud detection
Andrew Disney Marketing Director
30th January, 2020 | 5 min read
Discover how to use link analysis techniques for fraud detection in this step-by-step example showing typical...
Andrew Disney Marketing Director
30th January, 2020 | 5 min read
Discover how to use link analysis techniques for fraud detection in this step-by-step example showing typical...
Andrew Disney Marketing Director
14th January, 2020 | 5 min read
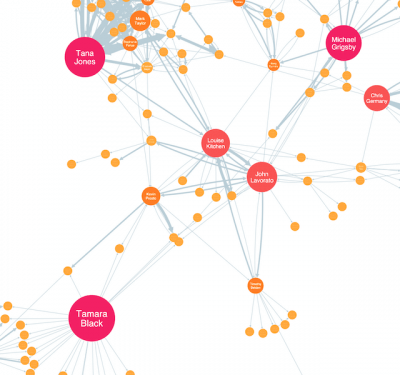
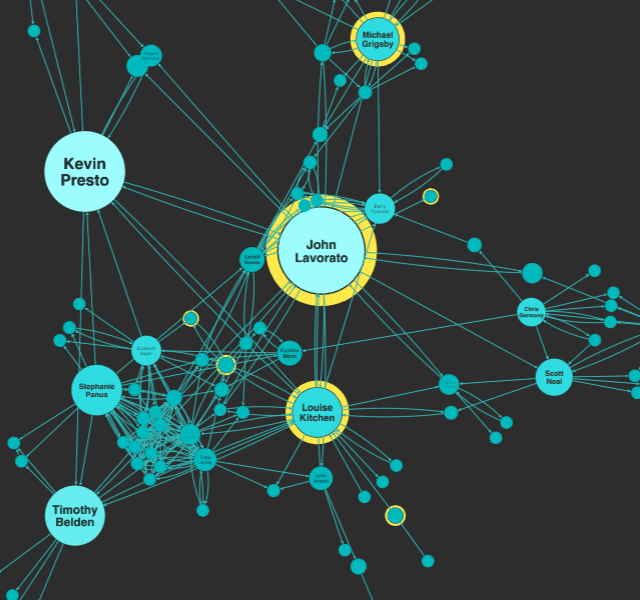
PageRank centrality & EigenCentrality are powerful graph functions in our visualization technology. Discover...

Gizem Unal Head of Marketing
13th January, 2020 | 9 min read
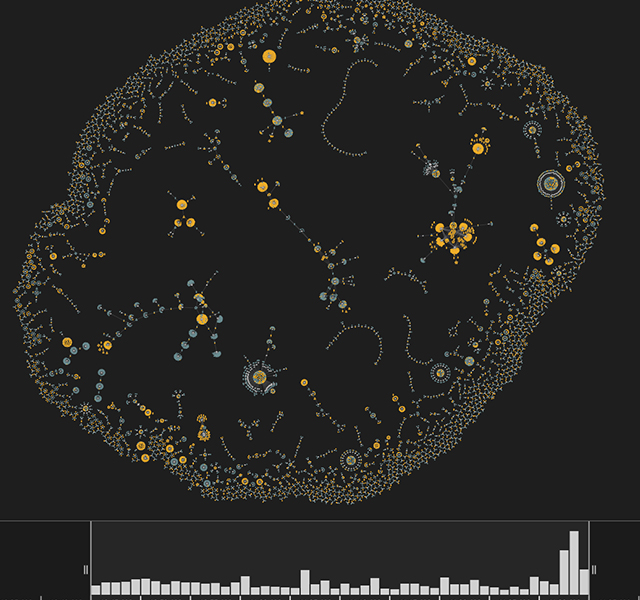
Our graph visualization technology is a particularly good fit for large, complex networks stored as knowledge...
Andrew Disney Marketing Director
2nd January, 2020 | 5 min read
Here’s everything you need to get started with centrality measures: what they are, what they tell us and...
Andrew Disney Marketing Director
30th September, 2019 | 4 min read
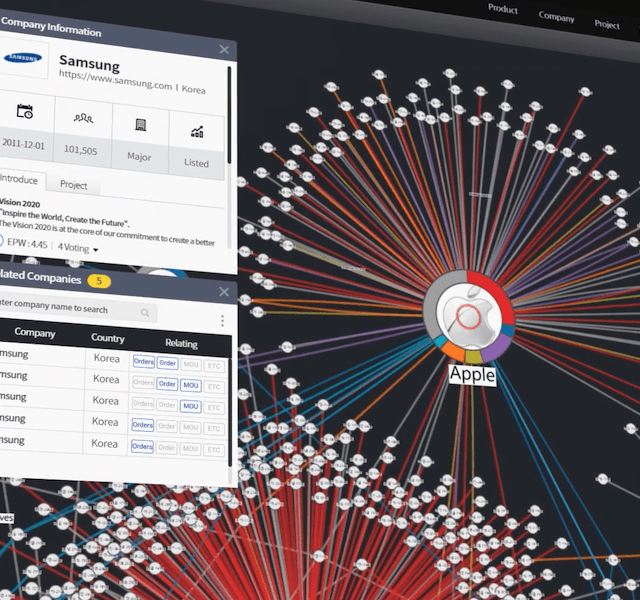
This case study looks at how South Korean startup, Illunex, combines AI with KeyLines’ graph visualization...
Rosy Hunt Content Marketing Specialist
13th September, 2019 | 10 min read
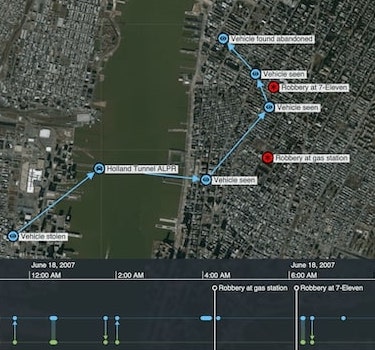
Find out how to use network visualization to make sense of cryptocurrency transaction patterns, focusing on...
Kevin Naughten Senior Product Manager
15th July, 2019 | 6 min read
Let’s create visual models that deliver the best user experience (UX). Detailed graph visualizations from an...
Thomas Chan Software Developer
12th February, 2019 | 7 min read
Learn how to integrate KeyLines with Esri’s open source esri-leaflet library to access their ArcGIS mapping...
Duncan Grant Sales Engineer
28th January, 2019 | 8 min read
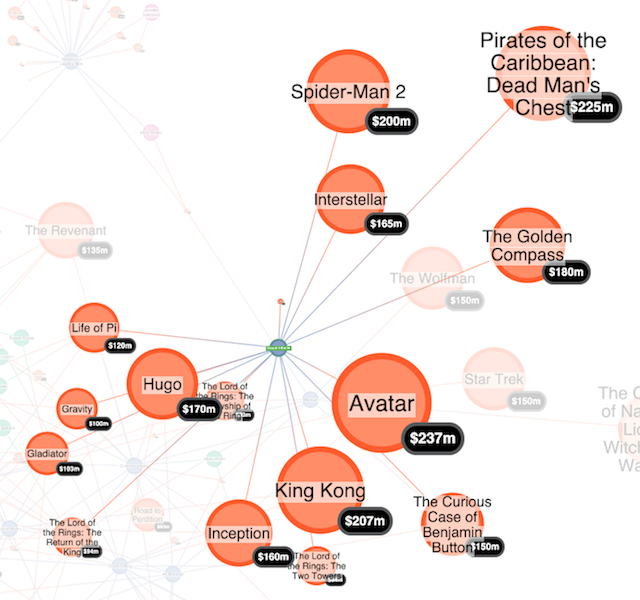
This blog post shows how quick and easy it is to integrate Stardog with KeyLines using Academy Awards data....
Registered in England and Wales with Company Number 07625370 | VAT Number 113 1740 61
6-8 Hills Road, Cambridge, CB2 1JP. All material © Cambridge Intelligence .
Privacy Policy | Security Framework
