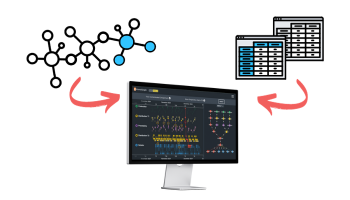
Our data visualization SDKs make it quick and easy to build powerful graph, timeline and geospatial visualization applications.
Each SDK works with any browser, device, server or JavaScript framework, so you can build on the tech stack that suits you best.
Step 1: Get to know the SDKs
Each SDK: KeyLines, Regraph, KronoGraph and MapWeave, is built for a different kind of visualization. Start by exploring our SDKs to see how you can design applications that fit your users’ workflows. See live demos, read the technical docs, and experiment in the interactive playgrounds to see how they work.
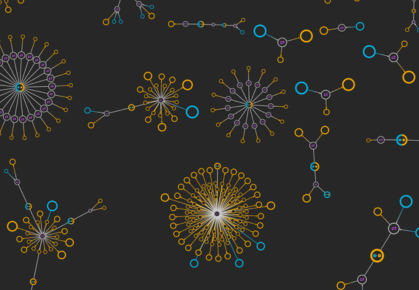
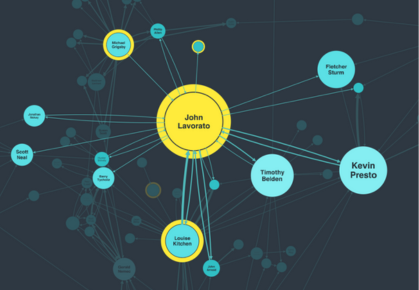
Graph
Step 2: Integrate your tech stack
Learn how to visualize your own data using our SDKs. Follow step-by-step guides for Neo4j, Elasticsearch, GraphQL and more, including working examples and best practices.
Our SDKs are completely database agnostic. Many customers pair our SDKs with one of the technologies below, but you’re free to use whichever datastore you prefer – from the latest graph database, to your trusty relational store or even just a CSV file.

Neo4j
Kick-start your graph and timeline visualization projects with the world’s most popular – and arguably most user-friendly – graph database

Amazon Neptune
Enjoy the performance, reliability and availability of Amazon Neptune – a serverless graph database hosted by Amazon Web Services

Azure Cosmos DB
Build cloud-native graph visualization apps with Microsoft’s fully managed, distributed NoSQL and relational database – Cosmos DB

DataStax
Create apps at scale with DataStax Enterprise (DSE) graph, making use of Apache CassandraTM and Apache TinkerPopTM
ArangoDB
Integrate seamlessly with ArangoDB – a next-generation graph data platform and database used by thousands of organizations worldwide

Memgraph
Take advantage of Memgraph’s open source graph database, designed to combine performance with advanced analytical capability
Stardog
Unleash insight with Stardog’s enterprise knowledge graph, designed to join the dots in data and power the connected enterprise

JanusGraph
Build on the Apache TinkerPopTM stack for scale and flexibility with JanusGraph – the open source successor to the Titan graph database

TigerGraph
Get enterprise-scale graph data insights by combining our graph and timeline visualization SDKs with the TigerGraph data platform

OrientDB
Get the best of both worlds with OrientDB – an open source multi-model database combining graph, document, key/value and object models

Titan
Trust the TinkerPopTM original – Titan – a scalable graph database optimized for billions of vertices and edges on a distributed architecture


Elastic + KeyLines/ReGraph
Elastic is a popular choice for teams needing to combine disparate data sources in a timeline or graph view

Step 3: Build your own integration
Use our SDKs to create custom, production-ready visualizations. Request a trial to access the full libraries and resources.
Registered in England and Wales with Company Number 07625370 | VAT Number 113 1740 61
6-8 Hills Road, Cambridge, CB2 1JP. All material © Cambridge Intelligence .
Privacy Policy | Security Framework
