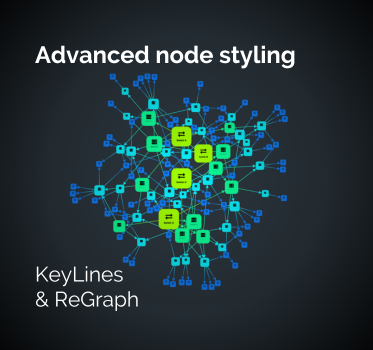
The advanced node styling users want in their graph visualizations
Dan Williams Chief Product Officer
7th March, 2023 | 3 min read
KeyLines and ReGraph deliver an advanced level of node styling capability and almost limitless customization...
Dan Williams Chief Product Officer
7th March, 2023 | 3 min read
KeyLines and ReGraph deliver an advanced level of node styling capability and almost limitless customization...
Rosy Hunt Content Marketing Specialist
2nd March, 2023 | 5 min read
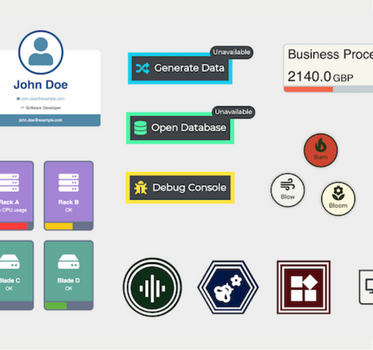
The latest major releases of our graph visualization toolkits empower software product designers to realize their...

Catherine Kearns Content Strategist & Team Lead
28th February, 2023 | 10 min read
We’ve blogged before about the benefits of graph visualization SDKs over open source graph libraries. There are...
Christian Lentfort Developer
14th February, 2023 | 11 min read
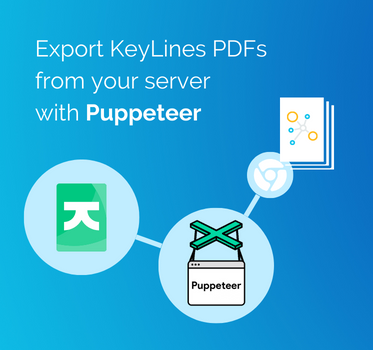
In this Puppeteer tutorial, developer Christian Lentfort shows you how to create a simple server application using...

Bonney O'Hanlon Product Manager
7th February, 2023 | 6 min read
We explore map data visualization: what it is, what it’s for, and why you need it if you’re serious about...
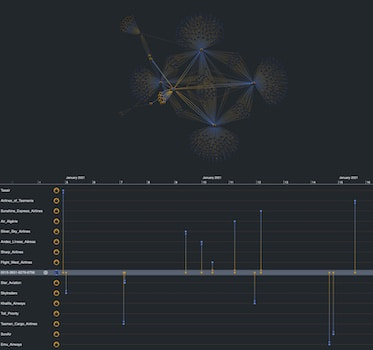
Bonney O'Hanlon Product Manager
31st January, 2023 | 7 min read
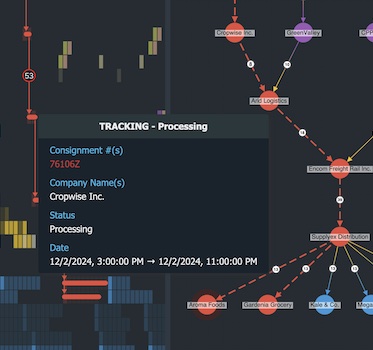
Over recent years we’ve seen more and more businesses digitizing their supply chain processes. Our latest demo...
Corey Lanum Chief Product Evangelist
3rd January, 2023 | 15 min read
Follow this tutorial to build an interactive web application – integrated with Amazon Neptune – to...
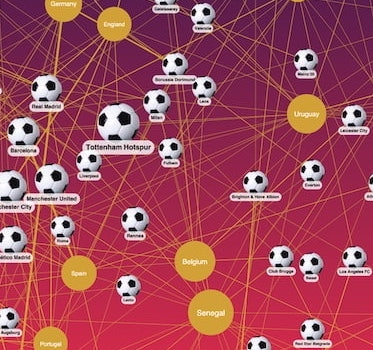
Dan Williams Chief Product Officer
18th December, 2022 | 9 min read
Here’s a story about how we made World Cup predictions that (almost) came true. After our successful...
Kevin Naughten Senior Product Manager
2nd December, 2022 | 10 min read
Bring the perfect graph visualization design to life: our KeyLines and ReGraph SDKs offer almost infinite...
Registered in England and Wales with Company Number 07625370 | VAT Number 113 1740 61
6-8 Hills Road, Cambridge, CB2 1JP. All material © Cambridge Intelligence .
Privacy Policy | Security Framework
