6 successful organizations and why they chose our technology
Rosy Hunt Content Marketing Specialist
12th April, 2023 | 9 min read
Seven of our most successful customers explain why they chose our data visualization technology....
Rosy Hunt Content Marketing Specialist
12th April, 2023 | 9 min read
Seven of our most successful customers explain why they chose our data visualization technology....

Bonney O'Hanlon Product Manager
7th February, 2023 | 6 min read
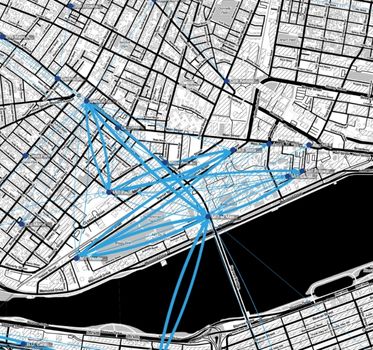
We explore map data visualization: what it is, what it’s for, and why you need it if you’re serious about...
Bonney O'Hanlon Product Manager
31st January, 2023 | 7 min read
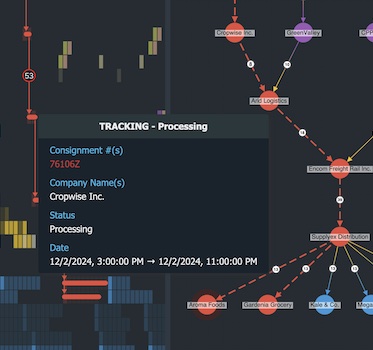
Over recent years we’ve seen more and more businesses digitizing their supply chain processes. Our latest demo...
Corey Lanum Chief Product Evangelist
3rd January, 2023 | 15 min read
Follow this tutorial to build an interactive web application – integrated with Amazon Neptune – to...
Dan Williams Chief Product Officer
18th December, 2022 | 9 min read
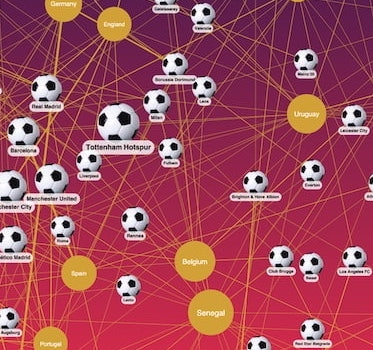
Here’s a story about how we made World Cup predictions that (almost) came true. After our successful...
Catherine Kearns Content Strategist & Team Lead
30th November, 2022 | 3 min read
If you want to optimize every stage of your supply chain, our ultimate guide to supply chain visualization is for...
Catherine Kearns Content Strategist & Team Lead
11th October, 2022 | 7 min read
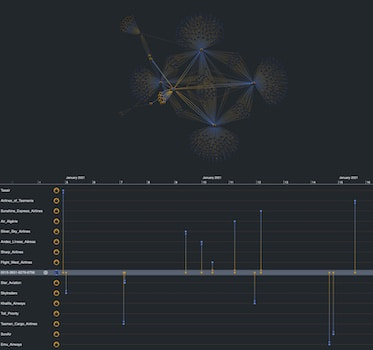
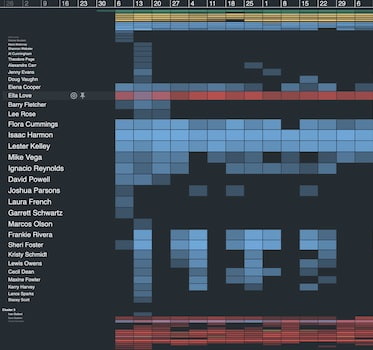
This post shows how unique navigation features in KronoGraph, our time-based visual analytics SDK, help analysts...
Christian Lentfort Developer
13th September, 2022 | 13 min read
We bootstrapped RedwoodJS to ReGraph, our data visualization toolkit for React developers, to build an app that...
Rosy Hunt Content Marketing Specialist
30th August, 2022 | 7 min read
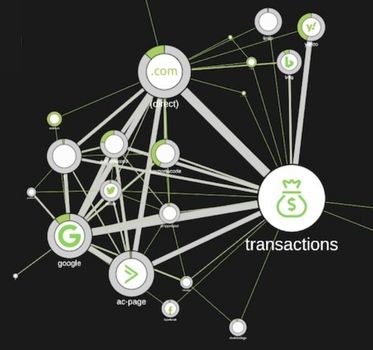
In marketing, ‘attribution’ can be a dirty word. It’s all about tracking human behavior, and using that data...
Registered in England and Wales with Company Number 07625370 | VAT Number 113 1740 61
6-8 Hills Road, Cambridge, CB2 1JP. All material © Cambridge Intelligence .
Privacy Policy | Security Framework
